As xkcd 1138 illustrates, mapping data by geography usually just turns into a population heatmap. More people, more of everything. I don’t often build mapping visualizations for this reason.
But sometimes geography actually matters. At Hello Gravel, we have an ecommerce platform for bulk landscape materials. Pricing varies a lot by location, with substantial differences between locations near a quarry and 200 miles away. Shipping by rail or barge changes the math.
With every U.S. zip code grouped into hundreds of regions, each with different pricing for different products, I wanted to more easily see anomalies. Where are we priced too high? Too low? Which regions have weird gaps? This is hard to spot in a spreadsheet, but on a map it’s obvious.
What it does
Gravel Atlas is an internal tool with a few views: pricing by region, order margins by geography, and a lookup tool to find vendors. The main interface is a US map where regions are colored by whatever metric you’re looking at. Green is good, red is bad (or cheap vs expensive, depending on the view).
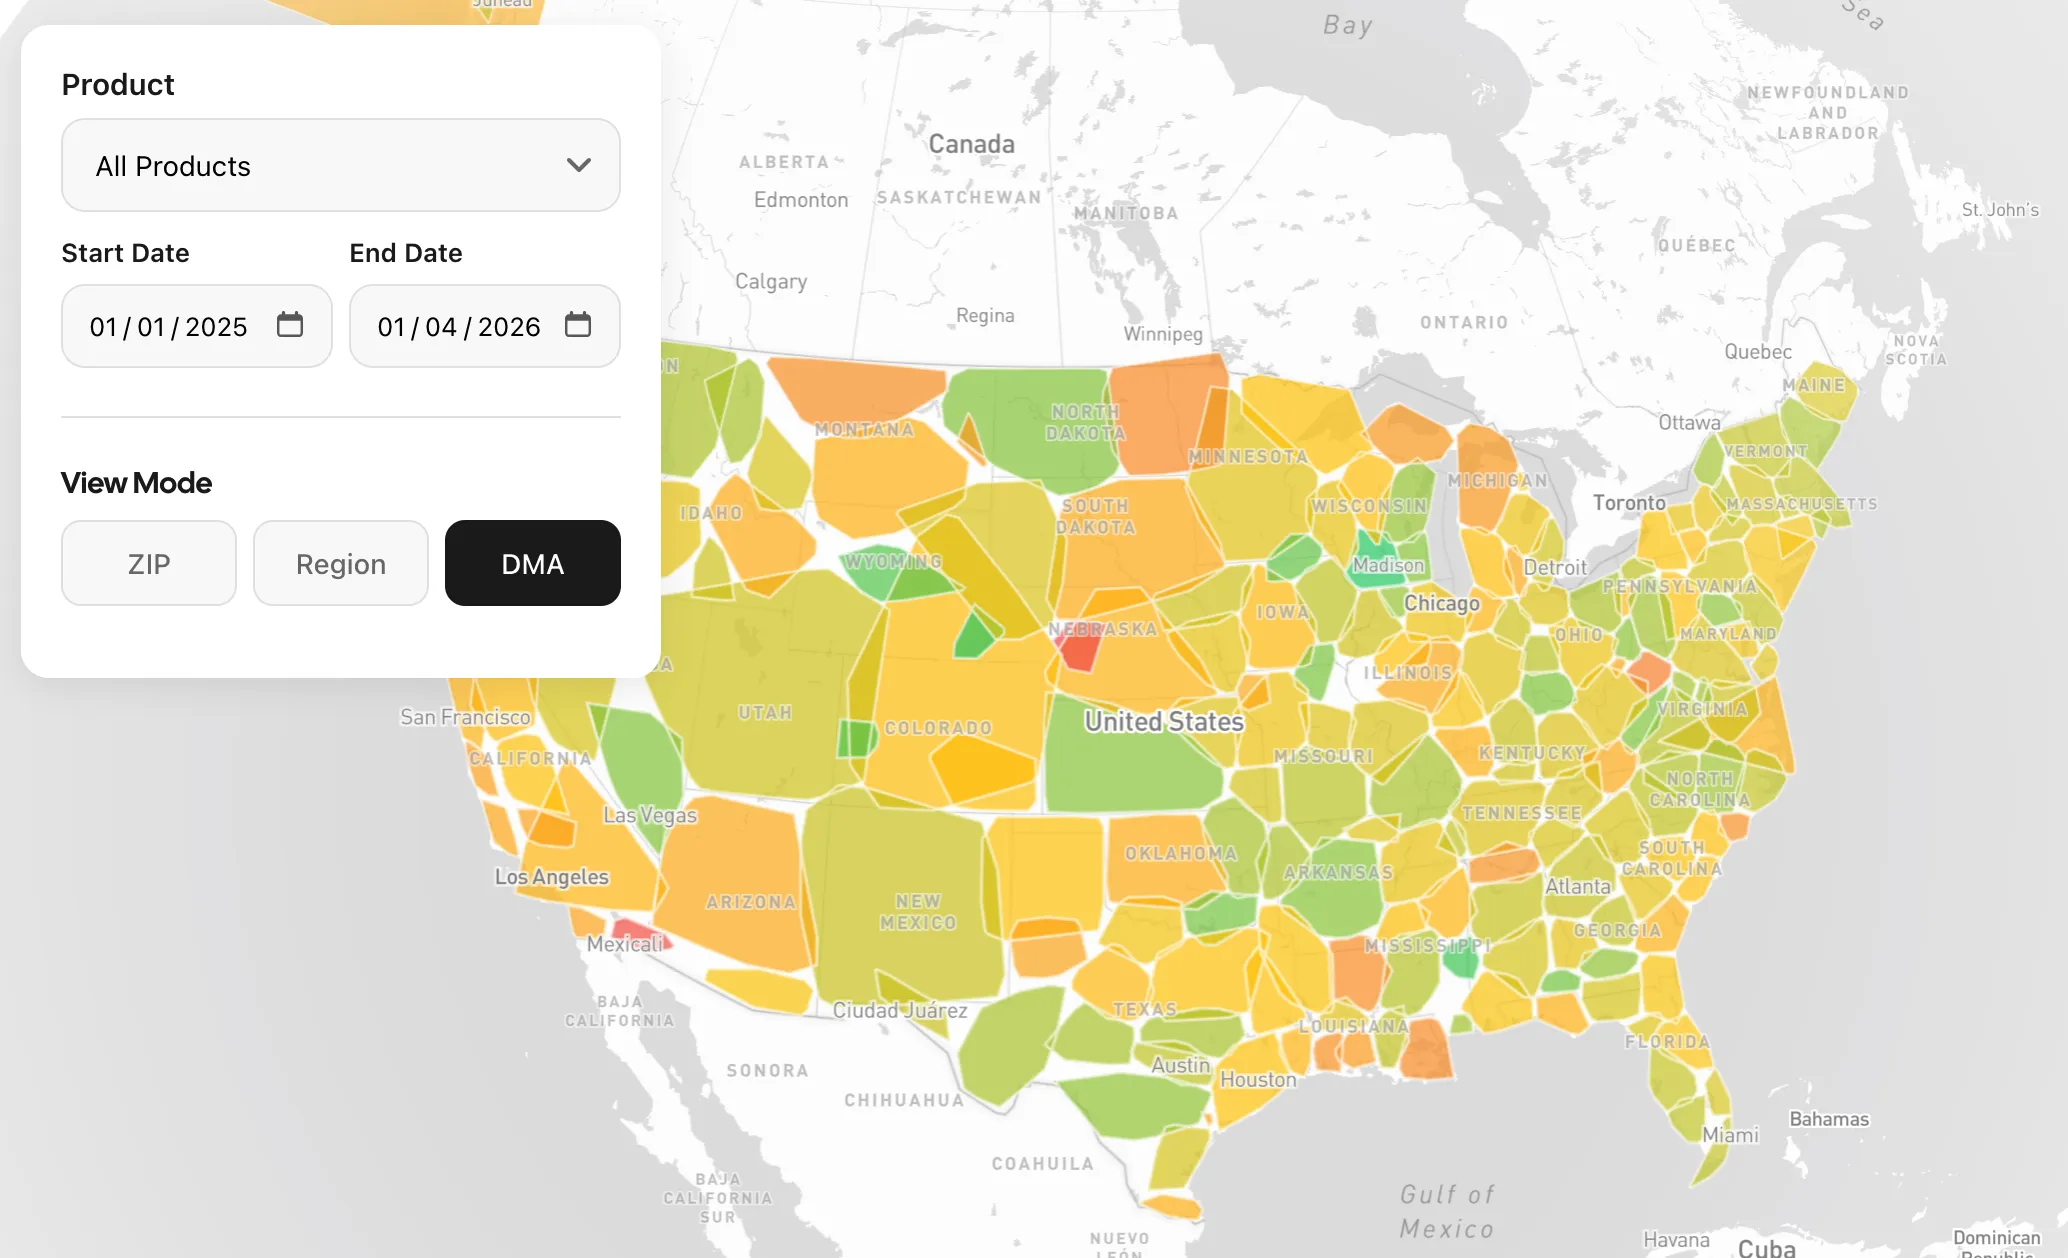
The most useful view shows profit margins by region. You pick a product and date range, and it shows our high and low margin areas, with patterns jumping out immediately.
How I built it
I started with Metabase, our internal analytics tool. I love Metabase, but it struggled here. Mapping regions was clunky, and it’s limited to 2,000 data points. With 30,000 zips, that wasn’t going to work.
This ended up being my first project with Claude Code. I opened a blank folder and just described what I was trying to do in plain terms: I have pricing data by region, I want to see it on a map, here are the tools we use in-house. Claude recommended the stack (React, Mapbox, Netlify Functions) and we built it together. First commit was November 19th; I shared it with the team later that afternoon.
Everything gets passed around as GeoJSON. The backend queries BigQuery, returns features with properties, and the frontend colors them.
One thing I had to figure out: making the color gradient useful regardless of the actual values. If margins range from 15% to 25%, I want green to mean 25% and red to mean 15%, not some absolute scale where everything looks the same. The solution is a two-pass approach. First pass collects all the values to find the range. Second pass normalizes each region to 0-1. Simple, but it makes the visualization actually informative.
It’s not perfect
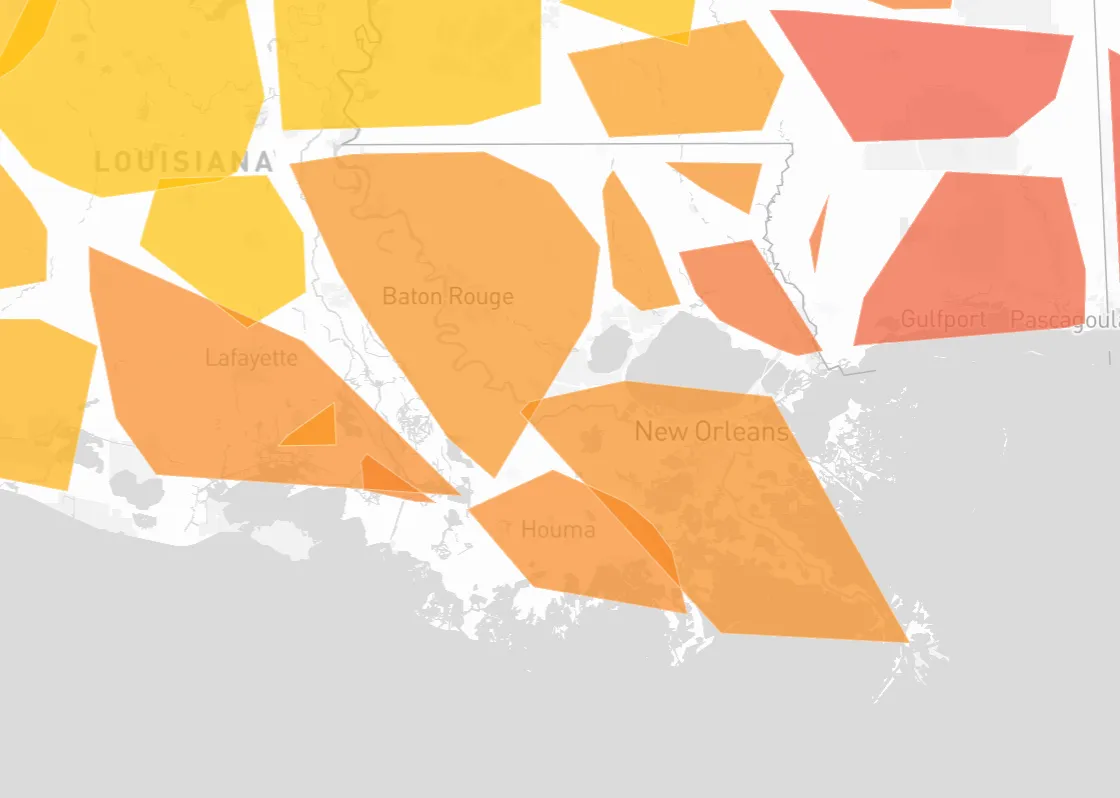
The regions look a bit chunky. I’m using the midpoint of each zip code to draw the boundaries rather than actual zip code geography. It’s fine for spotting patterns, but it won’t win any cartography awards.
There are probably ways to make it more efficient, but this is an internal tool used by a few people, not a high-traffic production app.
What we found
Within the first week, we spotted regions where our pricing was out of line and others where we needed more supplier coverage to improve pricing. The kind of stuff that’s hard to see in a spreadsheet but obvious when you’re staring at a map.
What I’m still thinking about
I’ve spent a good chunk of my career building reports in various tools: Power BI, Business Objects, Metabase, Salesforce reports, and of course plenty of stuff in Excel. You get good at working within the constraints. You learn the tricks to make the tool do what you need.
What’s different here is that I didn’t wrestle with a reporting tool at all. I described what I wanted and ended up with a visualization that fits exactly what I was trying to communicate. No compromises because the tool doesn’t support a certain chart type. No workarounds for data limits. Just the thing I had in my head, built in a day.
It’s not that reporting tools are obsolete. But for one-off internal tools where you know exactly what you want to see, this might just be faster than fighting with a dashboard builder. Next time I need a weird visualization, I’m not opening Metabase first.